The FrontEnd
 |
ONDEX suite
The FrontEnd |
|
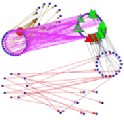
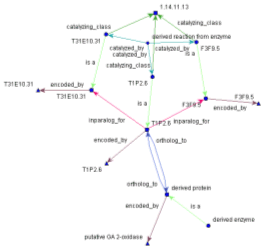
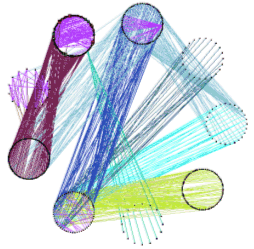
Visualisation Concepts are treated as nodes of a network graph. Relations are treated as the edges of a graph, that connect one node to another (or itself). This allows the visualisation of any kind of biological network, such as metabolic pathways, signal transductions, protein interactions etc. The ONDEX FrontEnd loads user-selected data sources from the Integrated data collection held in the back-end. Data to be loaded may be filtered by, for example, one or more specific species. Once loaded into the FrontEnd, graph objects may be saved as ONDEX XML or an XGMML form for either passing on to other applications or to store an interim point in an analysis for later re-use or for future reference. The visualisation of graphs is performed using a number of different layout algorithms. The default layout being a fast circular layout. Specific layouts are used to display graph features according to need. Additional layout facilities can be added by the integration of further graph layout algorithms using the ONDEX graph library adaptor, an API for the inclusion of graph layout libraries into the ONDEX framework. A user can navigate through a graph network through the use of the in-built mouse features that enable pan, zoom, feature and area select together with the feature display which shows details of selected (highlighted) features and their links (relations) to other features. The ONDEX FrontEnd can handle very large numbers of concepts and their relations. The limitations being due to available memory and cpu. Graphs with an excess of 250,000 concepts together with their associated relations and meta-data are readily manipulated. Analysis The ONDEX FrontEnd is supplied with a number of �filters� that enable the complexity of the graphs to be reduced according to the problem being analysed. The filters selectively add or remove connected nodes (concepts) from the display according to user selectable rules of connectivity type (distance, level, equivalence etc.). Analysis is performed by applying the available filters to isolate the graph features that are of biological interest. The micro-array filter enables a set of analysed micro-array data to be used as a filter to connect only those concepts which relate to the arrays probe genes. The SubTreeFilter extracts a tree-like sub-graph from a given node. The number of levels being user selectable. A KnockOutFilter which can be used to determine the most important nodes at any given level, providing the number of nodes connected and also on user command, removes the less important nodes from the graph. Support for sequence extraction from the ONDEX back-end is provided along with support for the import of sequence comparisons back into the ONDEX back-end. In particular, support is provided for the analysis of ortholog groups determined by the INPARANOID approach. Support for exporting graph objects to Cell Illustrator and XML format. Please send comments about this web site to sabr.technical at lists.ondex.org |
  |